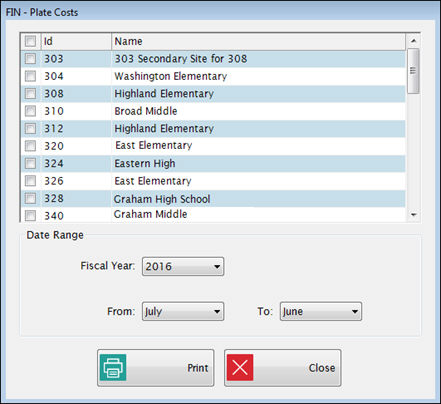
The Plate Cost Report is a managerial report that calculates the costs of producing each Breakfast, Lunch or Snack by site.
Management can use this information to monitor productivity and to determine where the costs for each meal are being incurred. For example, if one site has a high plate cost, you can see if the extra costs are due to increased food expense or employee costs.
It shows the actual number of meals served and converts them to Meal Equivalents based on the ratios that are set up in Administration: Meal Equivalents.
It calculates the cost to produce each type meal or snack, by site, and gives a cost breakdown by expense category.
Site assignments for expense accounts are set up in Manage Account.
Expense Categories are assigned to accounts under Manage Account.

Check the Site Id boxes to be included on the report.
Select the fiscal year from the Fiscal Year dropdown list.
Select a date range from the From/To fields.
Click Print.
SAMPLE PLATE COST REPORT
This report is for one school, from September to October.

The top part of the report shows the number of Meals Served from participation data, the Meal Equivalent ratios (that are set up under Administration), calculated number of Meal Equivalents during the report period, and the Percent that the meal represents out of all meals served.
This displays the Expenses, by Category, for the report period and allocates them based on the Percents established in the top section.
Expense Categories are assigned to accounts under Manage Account.
Breakfast Example:
©2018 EMS LINQ Inc.
FIN version 9 Help, revised 08/2018